Business 360
Viet Nam trade relations with EU Member States in EVFTA
The export turnover of our country's goods to the EU in September 2022 cooled down rapidly, to $3.62 billion, down 16.3% from the previous month, but still up 20% over the same period in 2021 and higher than the growth rate of 9.9% of the total export turnover of the country during this period.
The export turnover of our country's goods to the EU in September 2022 cooled down rapidly, to $3.62 billion, down 16.3% from the previous month, but still up 20% over the same period in 2021 and higher than the growth rate of 9.9% of the total export turnover of the country during this period.
1. General situation
The export turnover of our country's goods to the EU in September 2022 cooled down rapidly, to $3.62 billion, down 16.3% from the previous month, but still up 20% over the same period in 2021 and higher than the growth rate of 9.9% of the total export turnover of the country during this period.
In the first nine months of 2022, the country's export turnover of goods to the EU reached 35.7 billion USD, an increase of 23.4% over the same period in 2021, compared with an increase of 17.21% of the total export turnover. goods of the country.
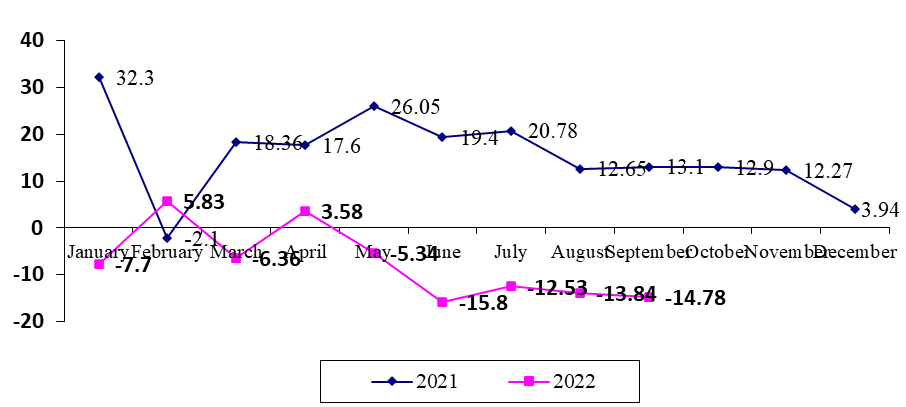
Import turnover of goods from the EU in September 2022 continued to decline sharply, to 1.15 billion USD, down 7.4% over the previous month and down 18.4% over the same period in 2021.
Generally, in the first nine months of 2022, the import turnover of goods from the EU reached $11.47 billion, down 7.6% over the same period in 2021.
In September 2022, our country's trade surplus with the EU reached 2.466 billion USD, down 20% compared to the previous August, but still increased by 50.4% compared to the same period in 2021. Generally, for 9 months of 2022, the surplus Our country's merchandise trade surplus with the EU reached 24.22 billion USD, a sharp increase of 47.4% over the same period in 2021, compared to the country's trade surplus of only 6.7 billion USD during the period.
Figure 1. Trade balance of Vietnam - EU over the months (billion USD)
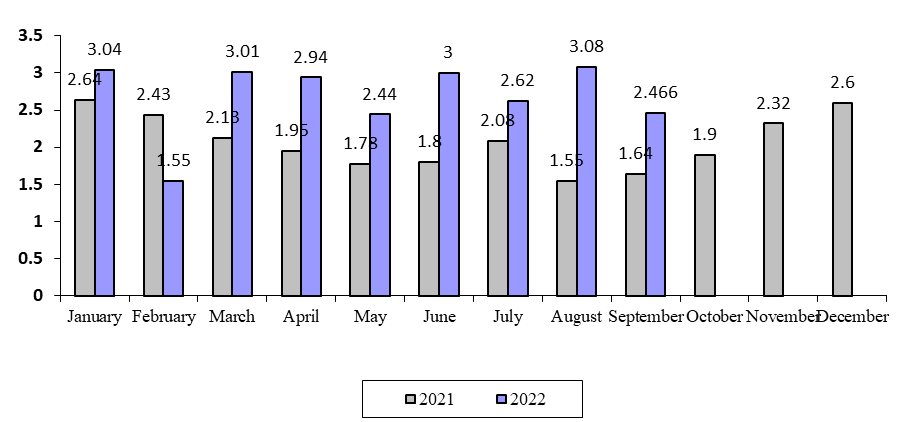
Figure 2. Export turnover of goods to the EU market over the months (billion USD)
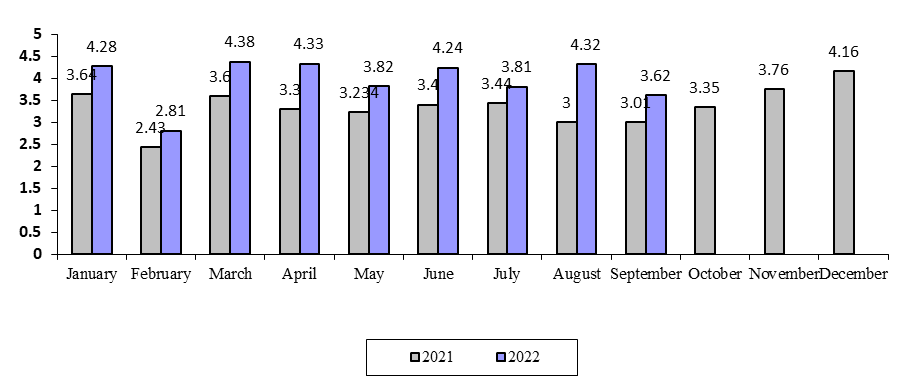
Figure 3. Change in export turnover of goods to the EU market over the same period last year over the months (%)
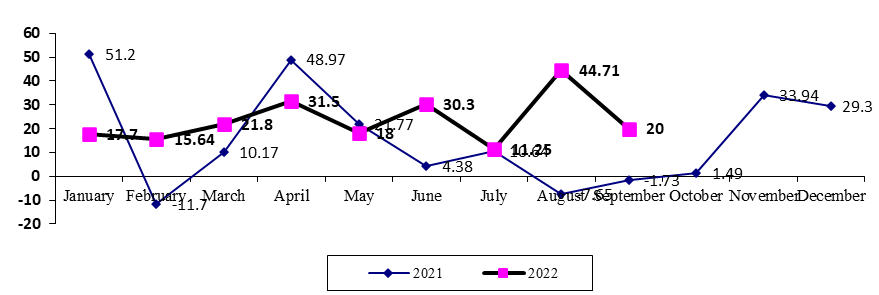
Figure 4. Import turnover of goods from the EU market over the months (billion USD)
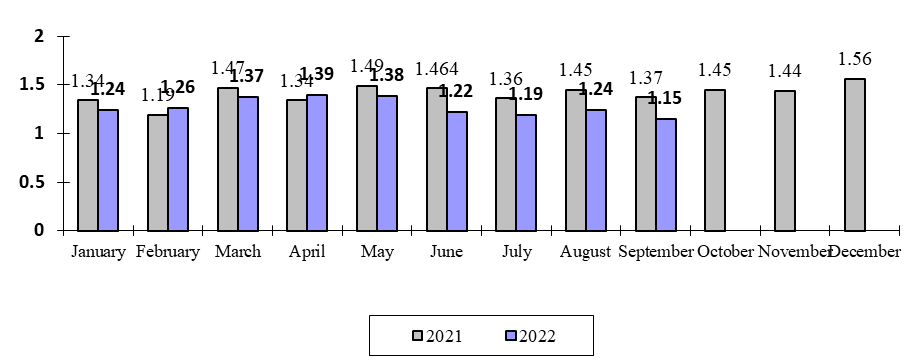
Figure 5. Change in import turnover of goods from the EU market compared to the same period last year (%)
Source: General Department of Customs
Comments and forecasts. As noted, the weak purchasing power due to the difficult EU economy, the sharp decrease in the demand to compensate for the shortfall, the strong depreciation of the Euro, and the rapid cooling of commodity prices will make our country's export turnover to the EU continue to grow. downward trend. Although the euro depreciates sharply, it will be difficult for imports from the EU to increase sharply because transportation costs are still expensive.
2. Export situation of Vietnam's goods to partners in EVFTA
The export turnover of our country's goods to the EU in September 2022 cooled down rapidly, down to 3.62 billion USD, down 16.3% from the previous month, but still up 20% over the same period in 2021. still higher than the growth rate of 9.9% of the total export turnover of the country during this period.
In the first nine months of 2022, the country's export turnover of goods to the EU reached 35.7 billion USD, an increase of 23.4% over the same period in 2021, compared with an increase of 17.21% of the total export turnover. goods of the country.
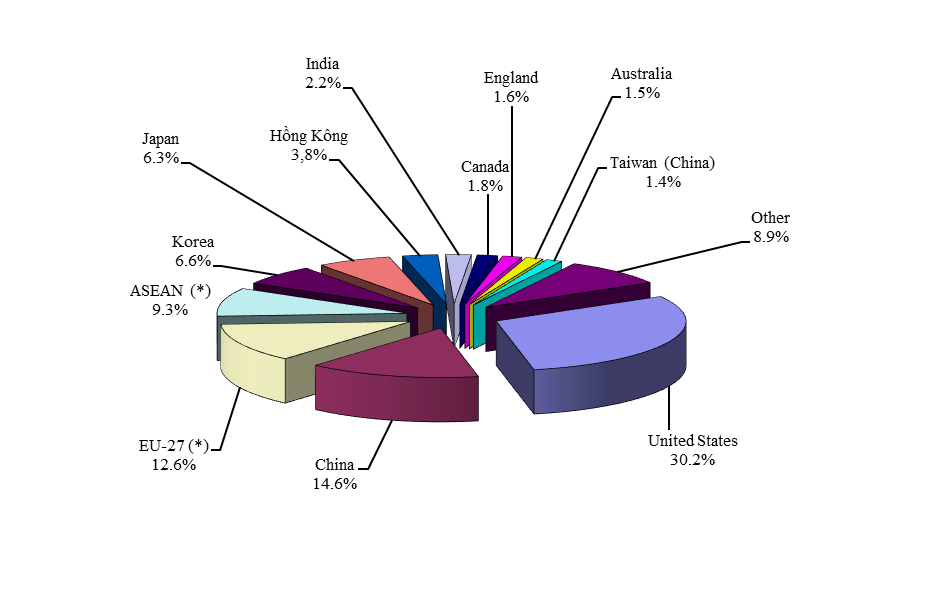
The proportion of goods exported to the EU in the total export turnover of goods of the whole country in September 2022 decreased slightly to 12.1%, compared with the proportion of 12.4% in the previous month, bringing the proportion of goods exports to the EU. 9 months of 2022 is 12.6%, up from 12% rate of 9 months of 2021.
Figure 6. Commodity export market structure of our country in September 2022
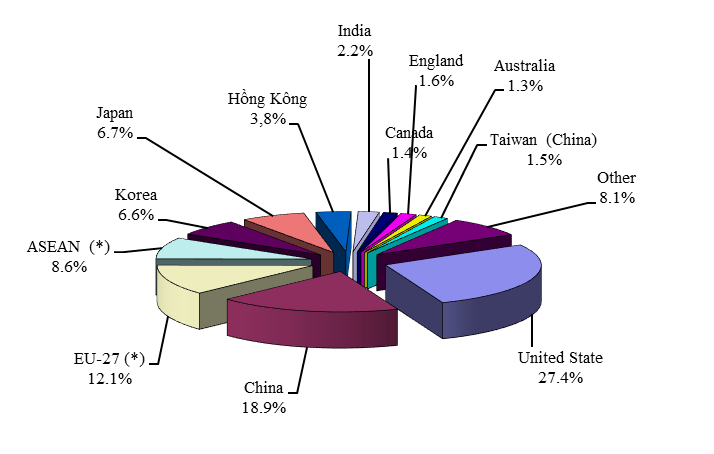
Figure 7. Commodity export market structure of our country in August 2022
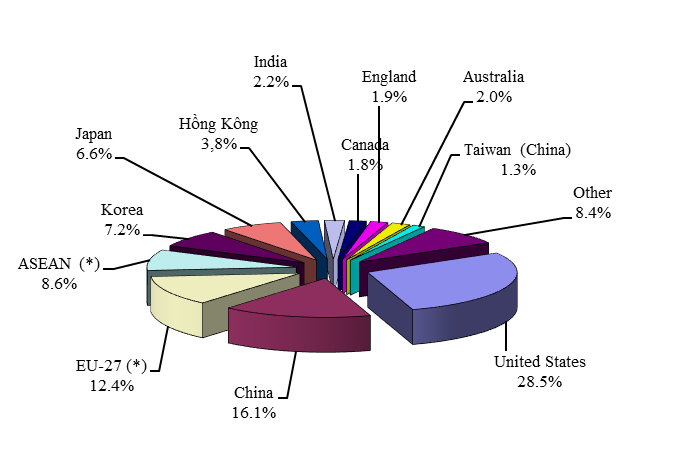
Figure 8. Commodity export market structure of our country in 9 months of 2022
In September 2022, our country's export turnover of goods to several large countries in the EU such as the Netherlands, Germany, and France all increased sharply compared to the same period in 2021. However, compared to August 2022, the value of Export turnover to most markets decreased.
Table 1. Export of goods to EVFTA partners
arket Name | September 2022 | 9 months of 2022 | |||
Value (millions of USD) | Compared to last month (%) | Compared to the same month last year (%) | Value (millions of USD) | S same period last year (%) | |
Total export turnover of the country | 29,817 | -14.61 | 9.9 | 282,347 | 17.21 |
FTA RCEP-15 market (*) | 12,595 | -11.59 | 9.53 | 108,686 | 15.78 |
FTA CPTTP-10 markets (*) | 4,156 | -20.51 | 13.45 | 40,729 | 22.64 |
FTA Eurasian Economic Union (EAEU)-5 markets (*) | 104 | -20.82 | -56.54 | 1,196 | -50.06 |
Brother | 488 | -26.3 | 21.56 | 4,650 | 8.07 |
EU-27 (*): | 3,616 | -16.29 | 20.02 | 35,696 | 23.74 |
Netherlands | 864 | -13.5 | 64.47 | 7,817 | 40.09 |
Virtue | 711 | -18.54 | 37.62 | 6,761 | 28.57 |
Italy | 339 | -8.42 | 21.49 | 3,403 | 21.11 |
Belgium | 282 | -4.76 | -1.73 | 3,144 | 22.41 |
France | 284 | -23.34 | 50.97 | 2,765 | 22.86 |
Spain | 174 | -28.32 | -27.78 | 2,259 | 22.78 |
T-shirt | 177 | -21.98 | -30.29 | 1,924 | -10.23 |
Ba Lan | 180 | -17.38 | 12.84 | 1,817 | 17.27 |
Switzerland | 90 | -32.76 | -14.71 | 984 | 19.53 |
Slovakia | 98 | -12.26 | -13.43 | 825 | -9.16 |
Czech | 60 | 5.59 | 23.04 | 466 | 10.23 |
Hungary | 49 | -1.59 | 38.04 | 444 | 2.71 |
Portugal | 43 | 32.97 | -25.27 | 406 | 5.99 |
Denmark | 31 | -30.38 | 69.29 | 385 | 51.76 |
Slovenia | 38 | 10.74 | 18.89 | 371 | 16.74 |
Ireland | 62 | -19.26 | 211.1 | 364 | 120.37 |
Greek | 27 | -18.59 | -19.24 | 294 | 17.99 |
Romania | 23 | -12.24 | 18.83 | 270 | 79.04 |
Latvia | 22 | -20.85 | -26.83 | 205 | 22.32 |
Finland | 10 | -22.22 | -48.93 | 172 | -21.41 |
Lithuania | 9 | -23.29 | 2.84 | 154 | 88.84 |
Malta | 1 | -96.59 | 286.92 | 137 | 1862.63 |
Bulgaria | 20 | 92.92 | 217.49 | 108 | 36.06 |
Luxembourg | 10 | -10.35 | 124.24 | 90 | -10.38 |
Croatia | 4 | -26.64 | 5.12 | 62 | 68.94 |
Cyprus | 3 | -35.2 | 93.43 | 37 | 40.3 |
Estonia | 2 | -49.39 | -14.15 | 32 | 28.64 |
Goods exported to the EU
In September 2022, the export turnover of the largest product, which is phones and components, dropped sharply compared to the previous month and over the same period in 2021, down 33.43% and 24.3%, respectively.
Meanwhile, the export turnover of many products, although decreased compared to the previous month, still increased sharply compared to the same period in 2021 such as footwear, machinery and equipment, textiles, bags, suitcases, and grain products. mugs, fruit, and veg,
Table 2. Export turnover of goods to the EU
| 9 months of 2022 | |||
Group/item name | Value (thousands of dollars) | Compared to last month (%) | Compared to the same month last year (%) | Value (thousands of dollars) |
Total turnover | 3,616,151 | -16.29 | 20.02 | 35,695,779 |
Cell phones and accessories | 523,329 | -33.43 | -24.25 | 4,982,971 |
Computers, electronic products, and components | 510,423 | -11.48 | 3.14 | 4,944,799 |
Footwear | 462,149 | -7.59 | 272.47 | 4,318,028 |
Other machinery, equipment, tools, and spare parts | 563,475 | -6.19 | 93.61 | 4,172,852 |
Textiles | 344,563 | -19.2 | 85.9 | 3,303,358 |
steels | 61,792 | 49.46 | -78.81 | 1,259,006 |
The coffee | 73,976 | -15.79 | -7.23 | 1,139,496 |
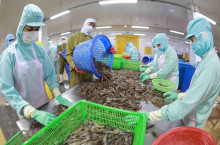
Seafood | 90,279 | -22.28 | 21.13 | 980,108 |
Vehicles and spare parts | 75,368 | -24.87 | 62.09 | 835,504 |
Products from iron and steel | 65,251 | -17.14 | 48.8 | 737,947 |
Handbags, wallets, suitcases, hats, and umbrellas | 71,036 | -13.01 | 207.58 | 678,423 |
Products from plastic | 40,993 | -24.55 | 7.17 | 472,015 |
Cashew | 44,678 | -25.2 | -34.92 | 461,274 |
Wood and wood products | 33,042 | -12.45 | 39.36 | 447,092 |
Toys, sports equipment, and parts | 60,213 | -2.42 | 44.86 | 423,047 |
Materials for textiles, garment, leather, shoes | 19,792 | -5.6 | 103.06 | 178,466 |
Rattan, bamboo, sedge, and carpet products | 11,702 | 0.47 | -5.96 | 147,424 |
Fruit and vegetable goods | 13,732 | -21.25 | 41.12 | 129,626 |
Confectionery and cereal products | 13,991 | -16.41 | 193.08 | 121,629 |
Pepper | 7,818 | -15.3 | -39.67 | 120,975 |
Cameras, camcorders, and accessories | 15,399 | -8.61 | 88.78 | 120,010 |
Chemistry | 7,999 | 5.62 | 6.3 | 114,760 |
Products from rubber | 6,745 | -34.52 | 16.3 | 93,012 |
Cao Su | 6,832 | -19 | -63 | 84,885 |
Plastic materials | 4,757 | -14.2 | 14.73 | 68,076 |
Ceramic products | 4,652 | -27.45 | 25.41 | 64,398 |
Gems, precious metals, and products | 6,408 | 22.79 | 17.11 | 60,456 |
Yarns, textile yarns of all kinds | 4,457 | -19.67 | 23.24 | 59,435 |
Other common metals and products | 5,779 | 34.54 | 52.99 | 51,050 |
Curtains, other technical fabrics | 4,423 & | |||
-cr-220x145.png)